SETUP IS CONNECTED
Mechanical changes propagate through multiple vehicle systems rather than affecting a single performance metric in isolation.

VEHICLE DYNAMICS · MATLAB · AERODYNAMICS · TYRES · SUSPENSION
SETUP & SENSITIVITY ANALYSIS
Developing an integrated vehicle model to investigate how mechanical setup influences tyre loading, lateral balance, aerodynamic platform and ride behaviour.
PROJECT OVERVIEW
I developed a MATLAB-based vehicle performance tool to explore how changes in mechanical setup propagate through the vehicle and influence tyre loading, lateral balance, aerodynamic performance and ride behaviour.
Rather than treating each subsystem independently, the model brings them together within a single workflow. This allows a setup change to be traced from its initial mechanical input through to its effect on the overall vehicle response.
Load transfer & grip
Lateral response
Downforce & ride height
Suspension & platform
1D & 2D analysis
Integrated analysis tool
MODEL ARCHITECTURE
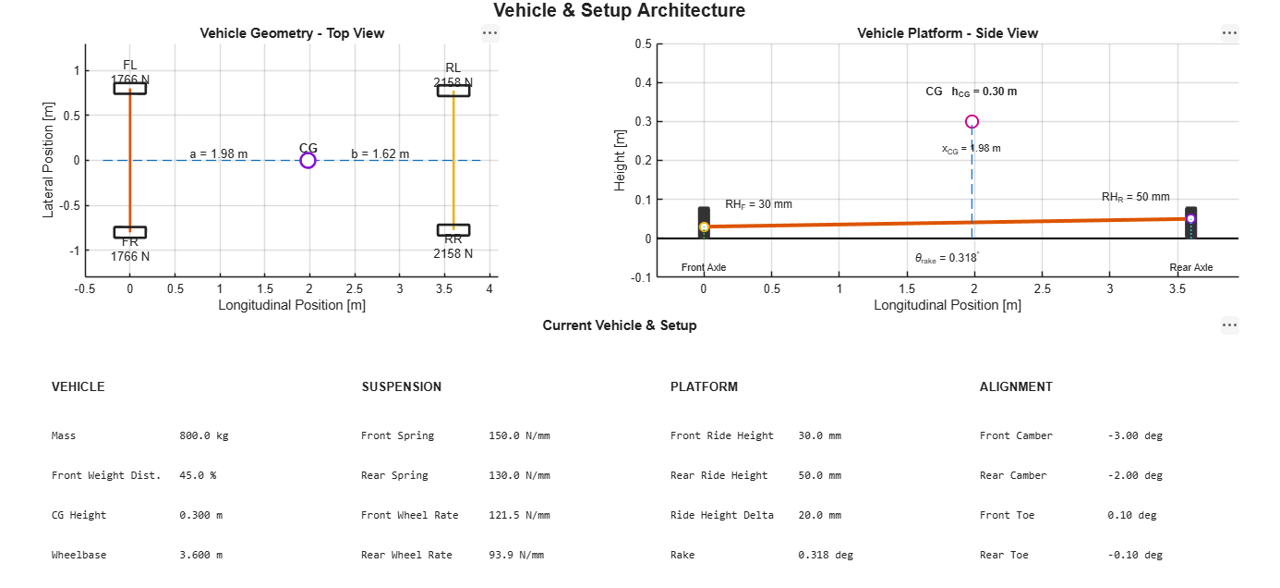
Vehicle geometry, mechanical setup, tyre behaviour and operating conditions form the inputs to the model. Each stage feeds the next, allowing the effect of a setup change to be followed through the complete vehicle.
Springs · ARBs
Ride height
Load transfer
Cornering stiffness
Lateral dynamics
Understeer gradient
Downforce
Aero map
Ride height
Compression
Balance · Grip
Vehicle checks
TYRES & LATERAL DYNAMICS
The lateral model connects axle load transfer with load-sensitive tyre behaviour to estimate available lateral force and the resulting balance of the vehicle.
Used to quantify how the balance changes with speed and setup.
AERODYNAMIC PLATFORM
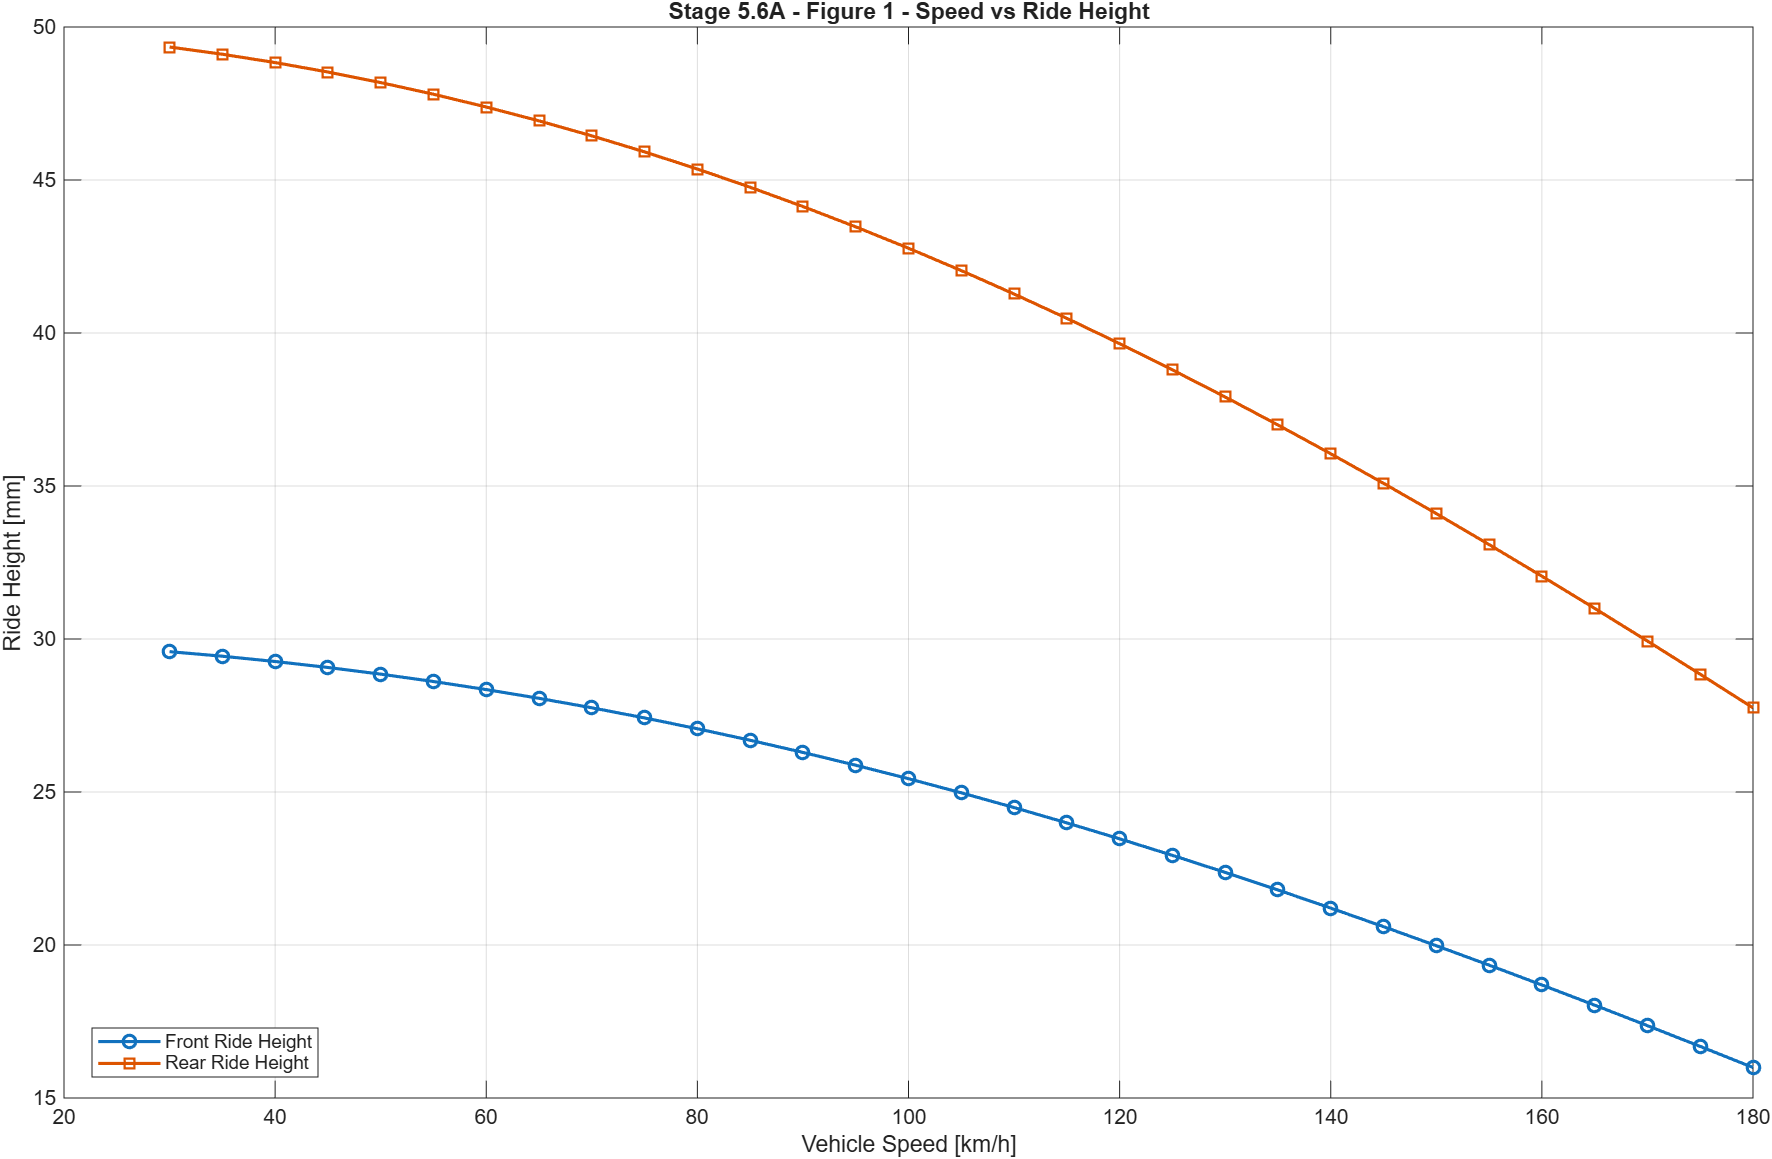
Vehicle speed determines aerodynamic load, while that load compresses the suspension and changes front and rear ride height. The updated platform is then used to evaluate the aerodynamic response.
SUSPENSION & RIDE DYNAMICS
A simplified ride model was used to investigate how spring stiffness influences suspension travel, body response and control of the aerodynamic platform.
This provides the mechanical side of the trade-off: a setup that improves platform control can simultaneously alter the transient behaviour of the vehicle.
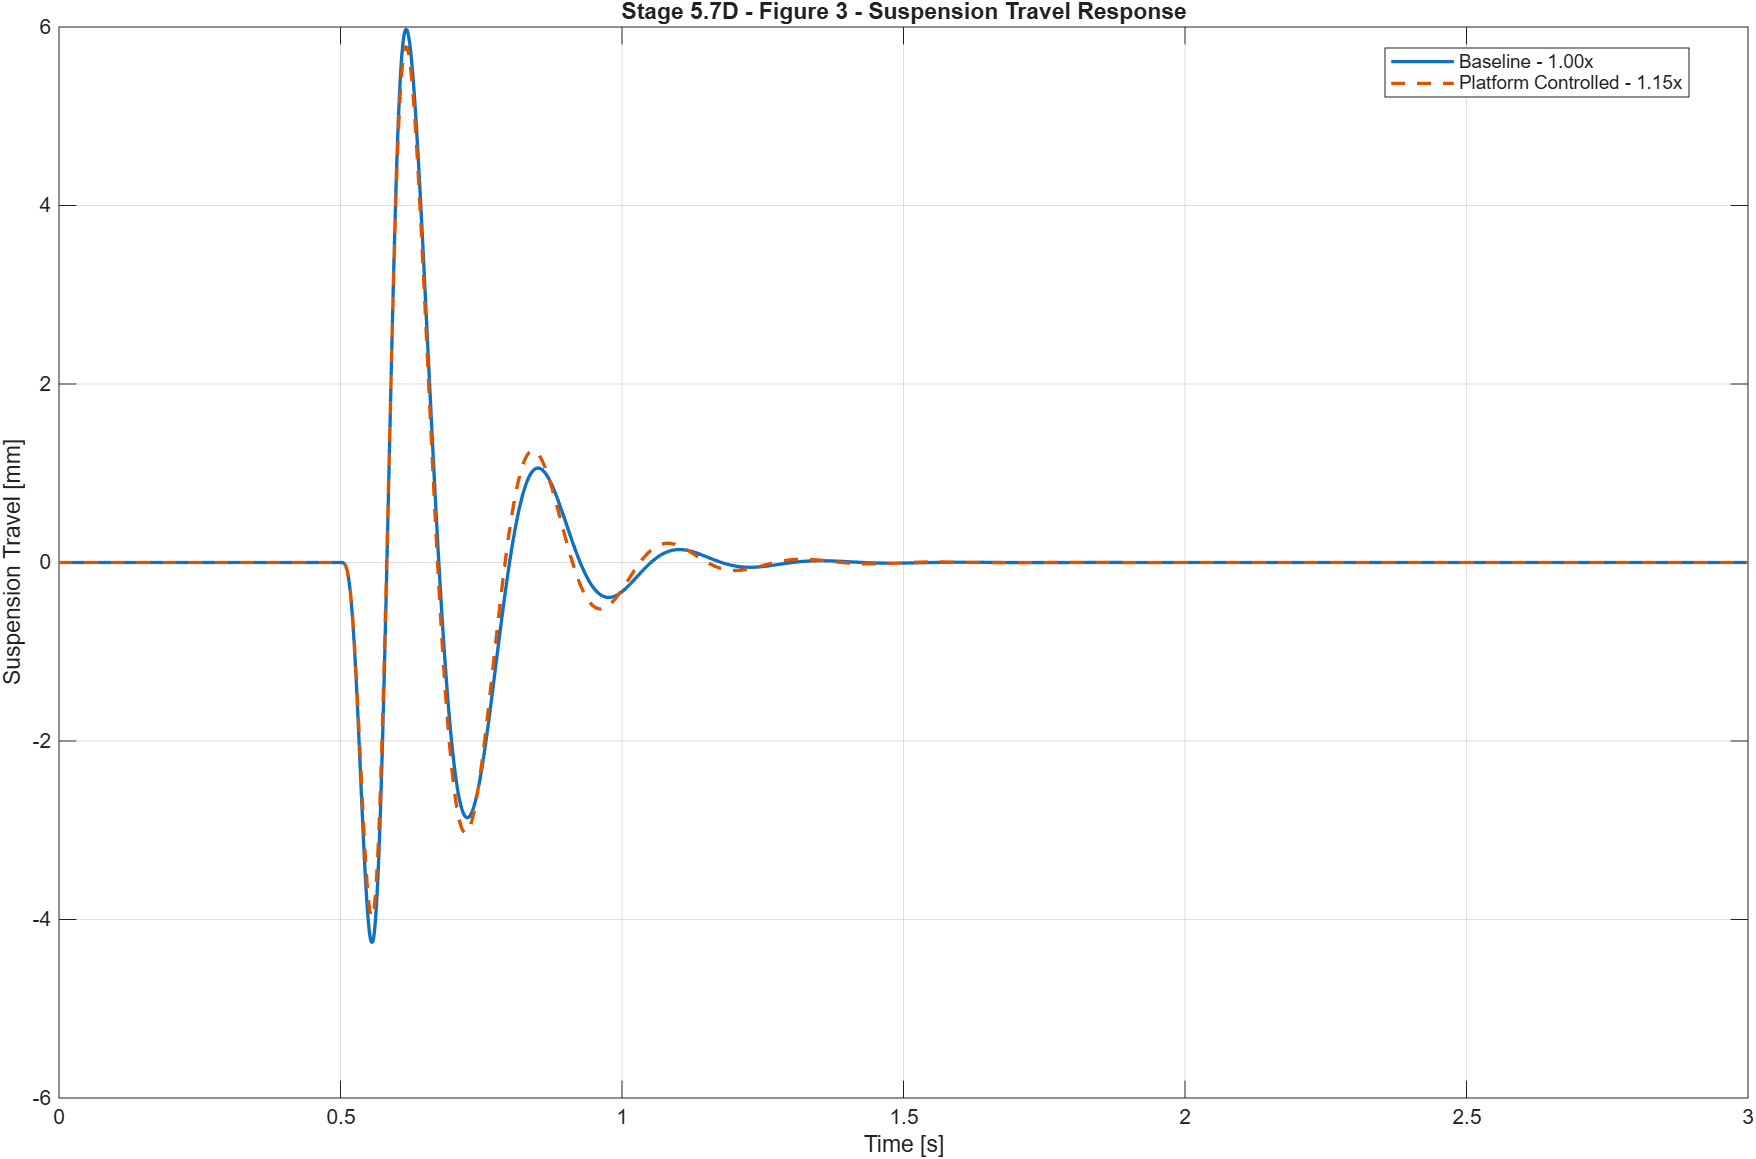
This shows the benefit of the setup change: peak suspension travel reduces from about 5.974 mm → 5.778 mm (−3.28%).
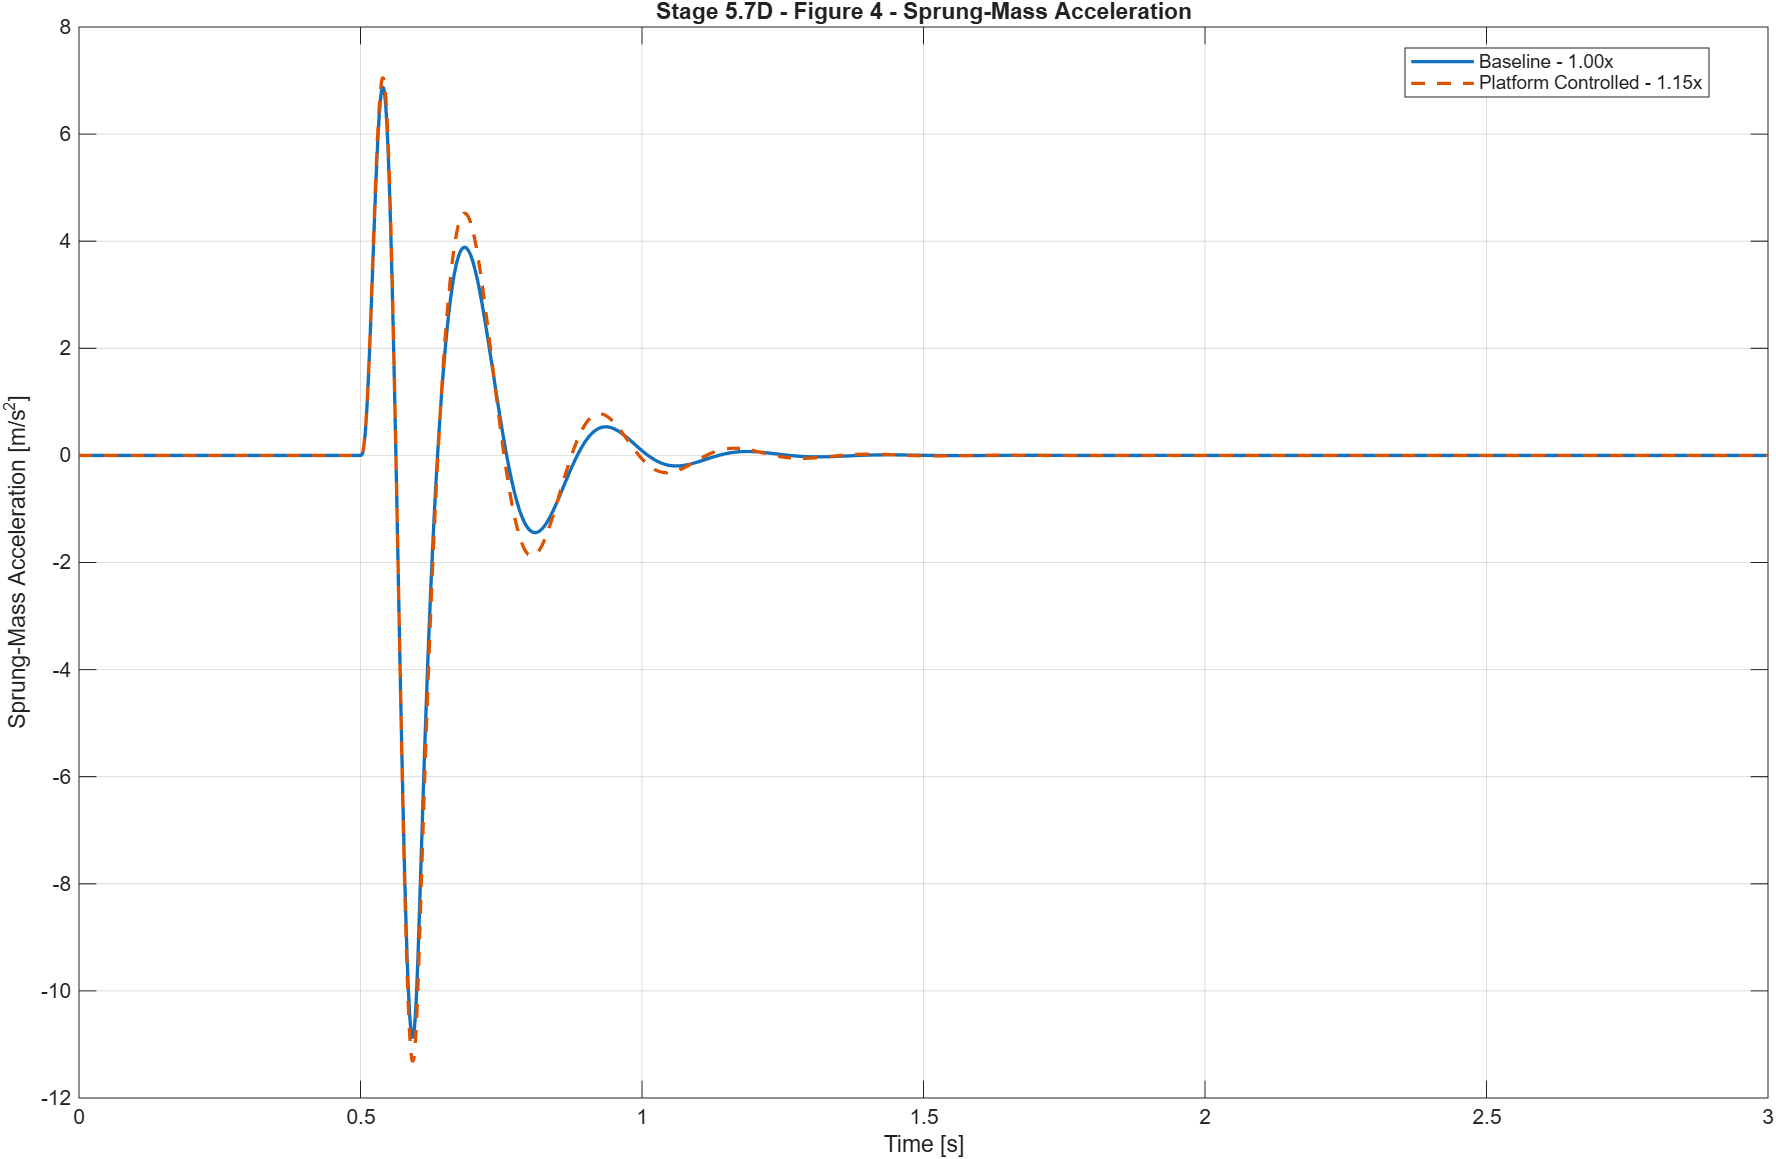
This shows the penalty: peak body acceleration increases from about 10.869 → 11.323 m/s² (+4.17%).
SETUP SENSITIVITY
Sensitivity studies first isolate individual setup parameters before extending the analysis into a two-dimensional design space. This makes it possible to identify trends, interactions and regions that warrant further investigation.
ONE-DIMENSIONAL
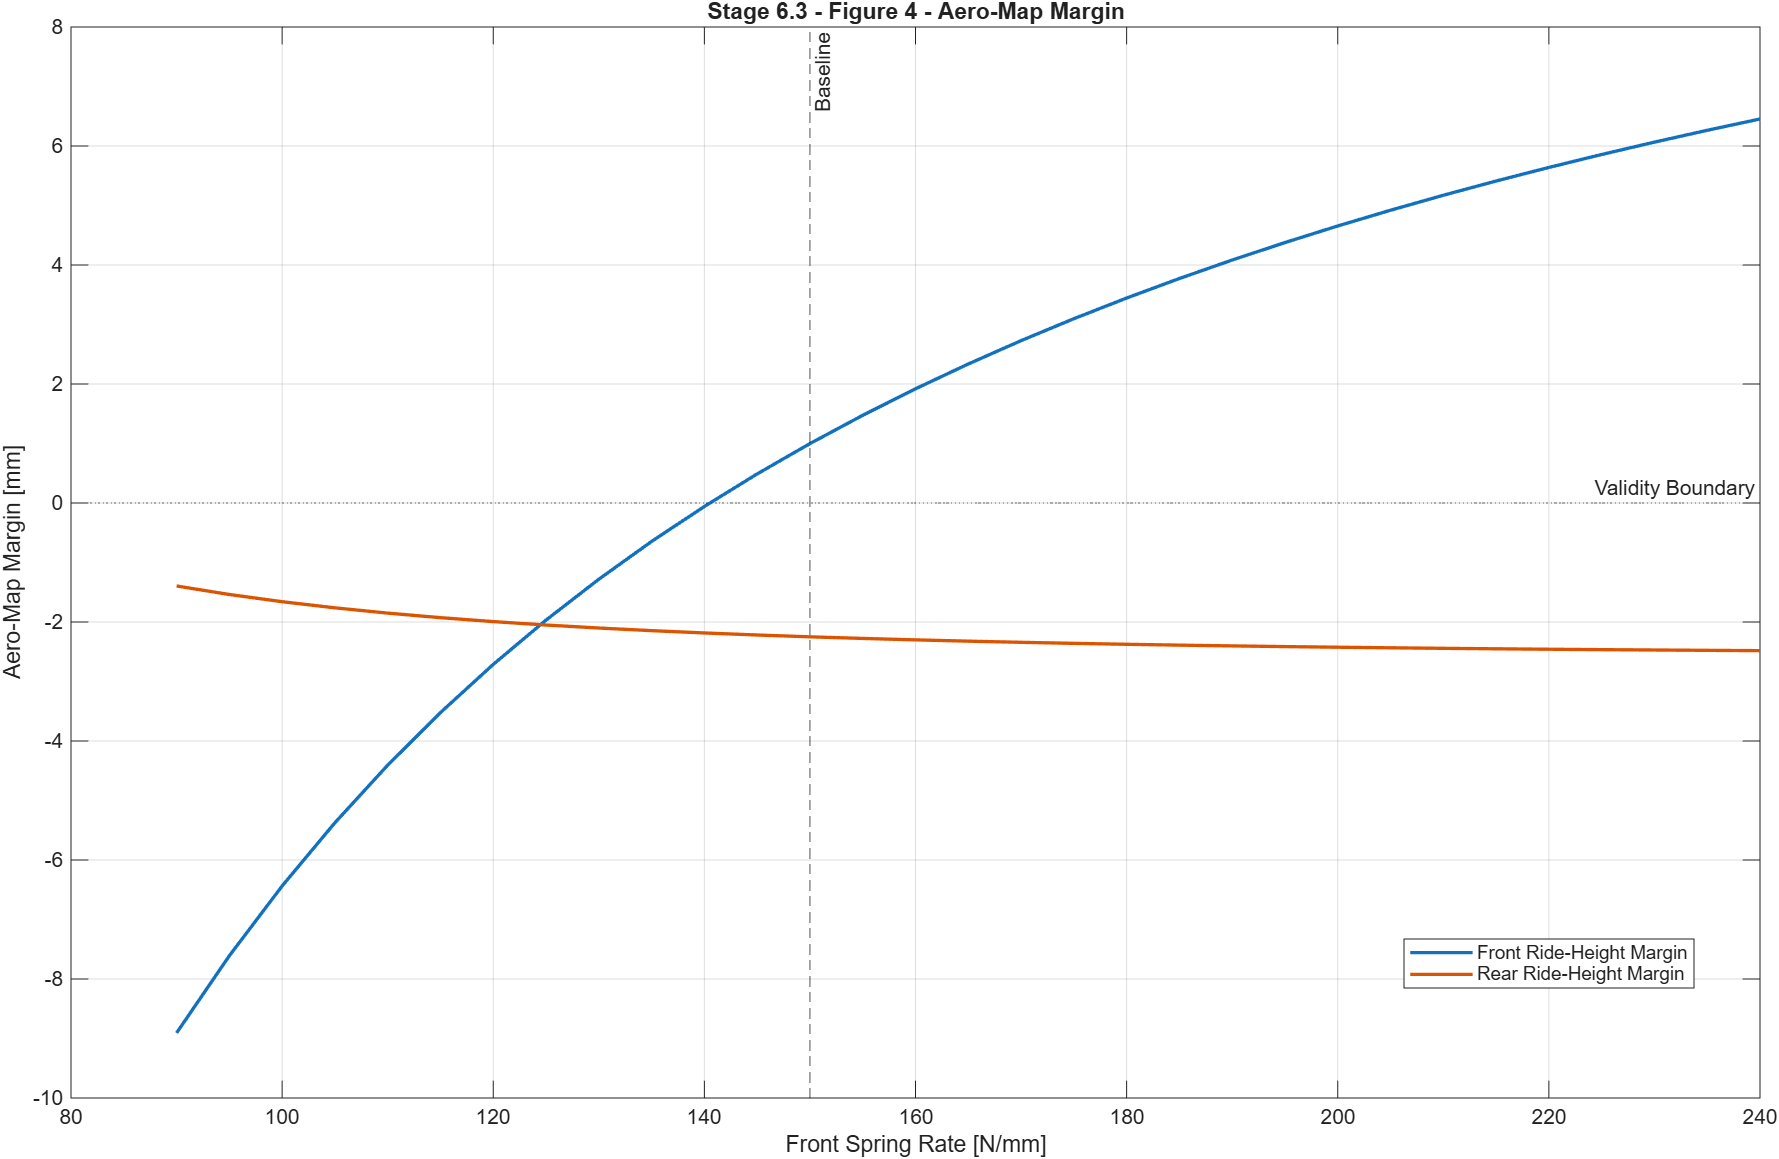
Sweep a single setup variable while holding the remaining parameters constant.
TWO-DIMENSIONAL
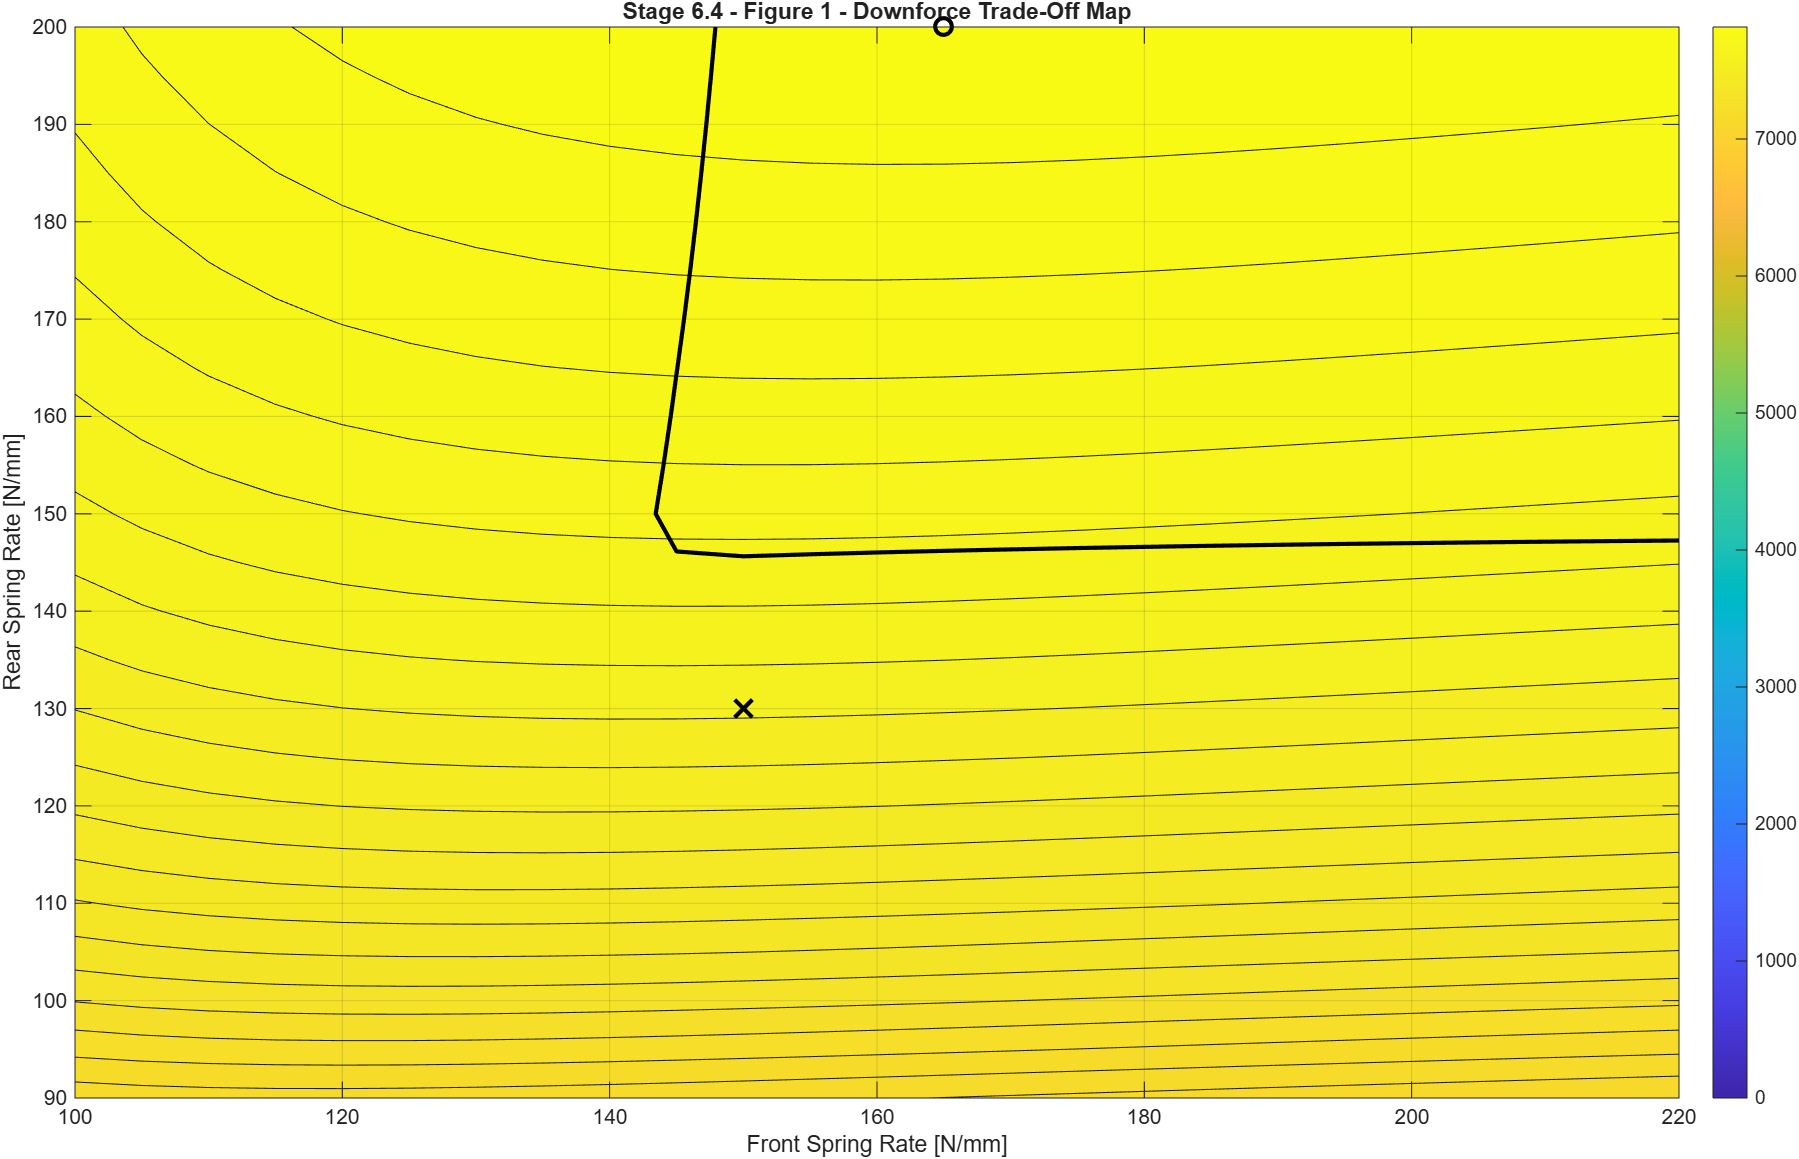
Explore interactions between front and rear setup parameters rather than evaluating each independently.
INTEGRATED PERFORMANCE TOOL
The individual models are combined within an interactive MATLAB dashboard. Setup inputs can be changed directly and the resulting vehicle state is recalculated across the complete model.
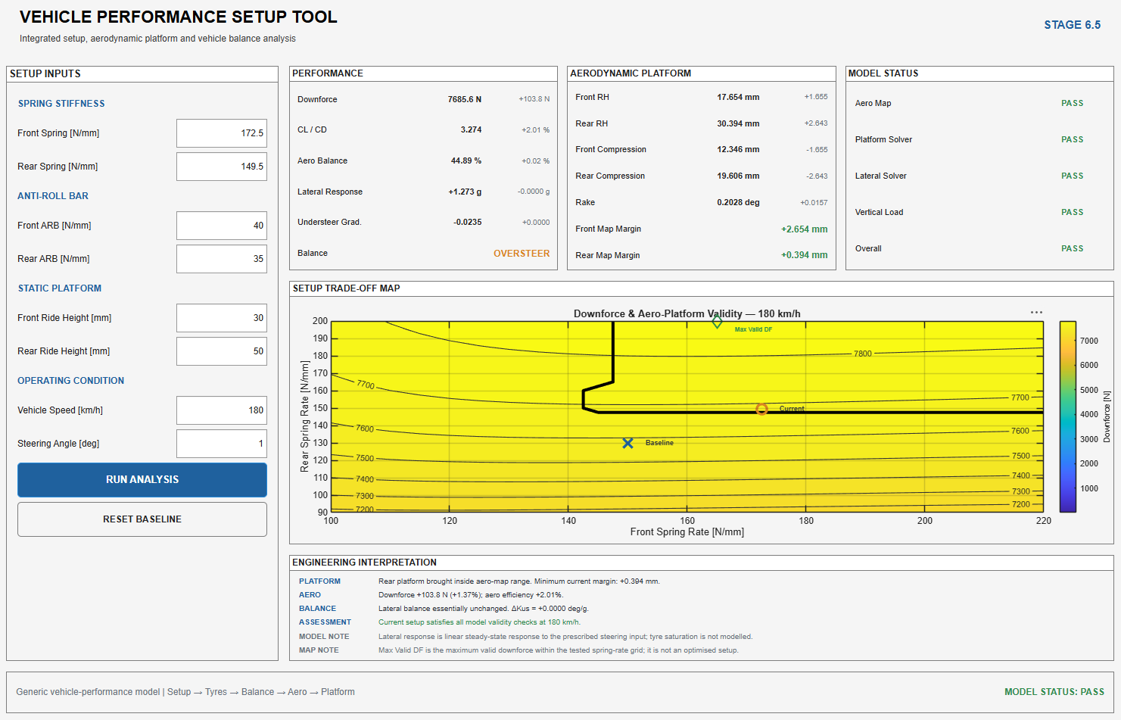
Mechanical parameters changed from a single interface.
Vehicle-level metrics update with the selected configuration.
Front and rear ride state remains visible alongside performance.
Model limits identify configurations outside the intended range.
INTEGRATED VALIDATION
A baseline configuration is compared with a revised setup to demonstrate how the tool can identify an undesirable vehicle state and evaluate a corrective setup change.
ENGINEERING TAKEAWAYS
Mechanical changes propagate through multiple vehicle systems rather than affecting a single performance metric in isolation.
Aerodynamic performance and mechanical platform behaviour need to be considered together when assessing setup.
Increased stiffness can improve one aspect of platform control while introducing compromises elsewhere in the vehicle response.
A sensitivity study identifies trends and useful design regions; it does not by itself define an optimised vehicle setup.
SOURCE CODE
MATLAB models, sensitivity studies and the integrated vehicle-performance dashboard are available within the project repository.